Considering Metrics for Building Qualifications🔗
Week Six CalTRACK Update🔗
Week six was primarily focused on the building qualification discussions and will continue to be the focus of testing and experimentation this week; this was coming off of an exciting working group meeting on March 15, 2018 linked below.
Recording: March 15, 2018 Working Group Meeting
Note: Zoom recording links may no longer be accessible.
Review of properties of intercept-only models in PRISM:
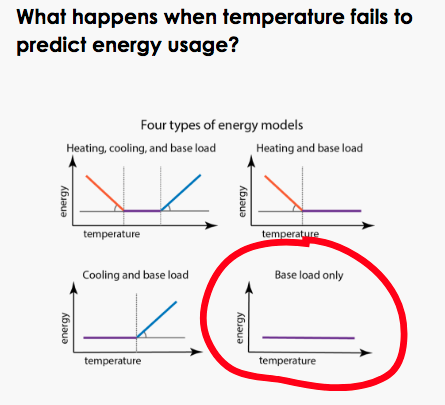
As we analyze building qualifications, it is useful to review the properties of PRISM intercept-only models to ensure they are properly treated. Here are a few characteristics of intercept-only models:
Properties:
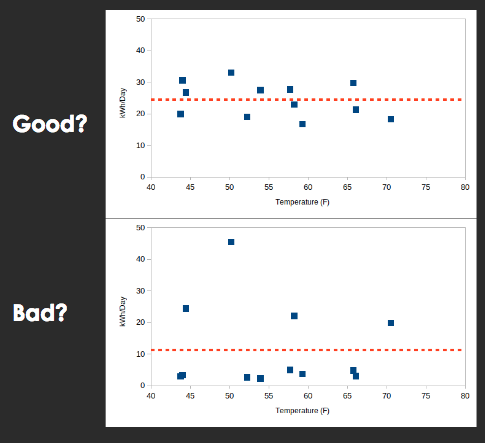
- Intercept-only models imply no significant effect of HDD or CDD on energy consumption was detected. Generally, this means that weather did not have a significant effect on the site’s energy consumption
- In intercept-only models, predicted energy savings are the difference between the current year’s energy consumption and the previous year’s consumption
- Significant temperature-related energy savings are not expected at sites with intercept-only models
Weaknesses:
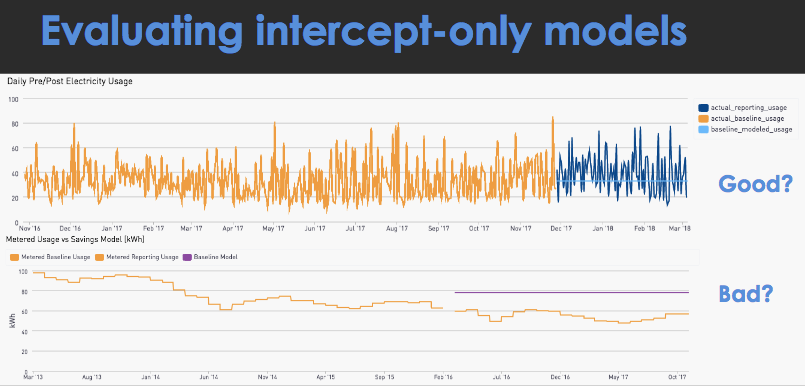
- These models are susceptible to poor savings estimates if the previous year was atypical. For example, if a resident did not live in their house for a majority of the previous year, then it may not be a good predictor of energy consumption in the current year
- Intercept-only models impose an average energy consumption over the entire year. This yearly average may be inappropriate when estimating more granular fluctuations, such as daily or hourly energy consumption
Description of Each Proposed Metric:
During the upcoming week, we will use empirical testing to establish the preferred metric and threshold to determine a building’s suitability for CalTrack methods. The two proposed metrics are described below:
Coefficient of Variation Root-Mean-Square-Error (CVRMSE)
The CVRMSE is calculated by:
- Measuring the distance between each predicted value and actual value
- Squaring each of these distances
- Averaging all of these squared distances from (2)
- Taking the square root of the average
Because the distances are squared in the CVRSME before they are averaged, outliers can have a large effect on this metric. In the context of pay-for performance, we are uncertain if it is advantageous to choose a metric that is sensitive to outliers or not. We look forward to seeing test results on this issue.
Mean Absolute Percent Error (MAPE)
The MAPE is calculated by:
- Subtracting each observation’s actual value from their predicted value
- Dividing by that observation’s actual value
- Taking the average of the value in (2) for all observations
- Multiplying by 100 to give the result in a percentage
The MAPE is another appealing metric. It is worth noting that with a MAPE calculation, it is problematic if the actual values are zero for observations because this would require dividing by zero, which is a mathematical problem.
Other Reference Materials on Baseline Models that inform the discussion:
In the Granderson, et. al. study cited below, one key question it tackled was: “How can buildings be pre-screened to identify those that are highly model predictable and those that are not, in order to identify estimates of building energy savings that have small errors/uncertainty?”
- Granderson, J., Price, P., Jump, D., Addy, N., Sohn, M. 2015. Automated Measurement and Verification: Performance of Public Domain Whole-Building Electric Baseline Models. Applied Energy 144:106-133.
In the Southern California Edison study, buildings were sorted into four categories to identify applicability of the analytical method.
- Southern California Edison with FirstFuel. February 2016. Energy Efficiency Impact Study for the Preferred Resources Pilot
Suggestions on Testing These Metrics
Remember, our goal for testing is to establish our preferred metric and threshold for building qualification. When testing the CVRMSE and MAPE metrics, we have some suggestions to yield the most informative results:
- Test residential, commercial, and industrial buildings separately. This provides information on CalTrack’s performance across different building types
- Test intercept-only model performance. This will inform model usage decisions in the future
Non-Routine Adjustments:
Some discussion arose regarding the possibility of making non-routine adjustments for sites that are outliers. CalTRACK 1.0 addressed this issue by stipulating specific criteria for accepting a non-routine adjustment. Specifically, if savings exceeded 50% +/-, either party would be able to make an appeal to remove the project from the portfolio. Other specific considerations may be related to program eligibility, such as a house that adds solar panels during a performance period. At a general level, CalTRACK methods shy away from stipulating methods for non-routine adjustments, as these tend to demand substantial additional effort and may require additional data that would run contrary to the premise of using CalTRACK methods in the first place. As CalTRACK 1.0 testing demonstrated, for aggregators of residential projects, larger sample sizes diminish the effect of these outliers.
Participant Homework:
- Review the Issues page and plans for testing on building qualifications
- Conduct your own tests on relevant questions
- Analyze test results as they emerge and comment